
A protein, of course, is a polypeptide chain made up of amino acid residues linked together in a definite sequence. Amino acids are "handed" (except for glycine, in which the normally asymmetric α-carbon has two hydrogens), and naturally occurring proteins contain L-amino acids. That handedness has far-reaching effects on protein structure, as we shall see, and it is very useful to be able to distinguish the correct form easily. A simple mnemonic for that purpose is the "corncrib", illustrated in Fig. 4. Looking from the hydrogen direction, the other substituents around the α-carbon should read CO—R—N in a clockwise direction (R is the side chain). Threonine and isoleucine have handed β-carbons. A mnemonic for both of them is that if you are standing on the backbone with the hydrogen direction of the β-carbon behind you, then your left arm is the heavier of the two branches (the longer chain in Ile and the oxygen in Thr).
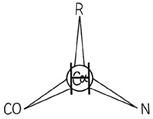
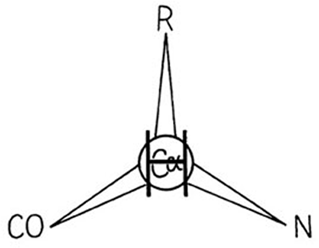
FIG. 4. The "corncrib": A mnemonic for the handedness of atomic positions around the asymmetric α-carbon in naturally occurring L-amino acids. Looking down on the α-carbon from the direction of the hydrogen atom, the other branches should be CO—R—N, reading clockwise (i.e., carbonyl, side-chain R, then main-chain N).
The sequence of side chains determines all that is unique about a particular protein, including its biological function and its specific three-dimensional structure. Each of the side groups has a certain "personality" which it contributes to this task. [see for a more extensive discussion of amino-acid roles.] Histidine is the only side chain that titrates near physiological pH, making it especially useful for enzymatic reactions. Lys and Arg are normally positively charged and Asp and Glu negatively charged; those charges are very seldom buried in protein interiors except when they are serving some special purpose, as in the activity and activation of chymotrypsin ; ). Asparagine and glutamine have interesting hydrogen-bonding properties, since they resemble the backbone peptides. The hydrophobic residues provide a very strong driving force for folding, through the indirect effect of their ceasing to disrupt the water structure once they are buried ; they also, however, affect the structure in a highly specific manner because their extremely varied sizes and shapes must all be fitted together in very efficient packing . Proline has stronger stereochemical constraints than any other residue, with only one instead of two variable backbone angles, and it lacks the normal backbone NH for hydrogen bonding. It is both disruptive to regular secondary structure and also good at forming turns in the polypeptide chain, so that in spite of its hydrophobicity it is usually found at the edge of the protein. Glycine has three different unique capabilities: as the smallest side group (only a hydrogen), it is often required where main chains must approach each other very closely; Gly can assume conformations normally forbidden by close contacts of the β-carbon; and it is more flexible than other residues, making it valuable for pieces of backbone that need to move or hinge.

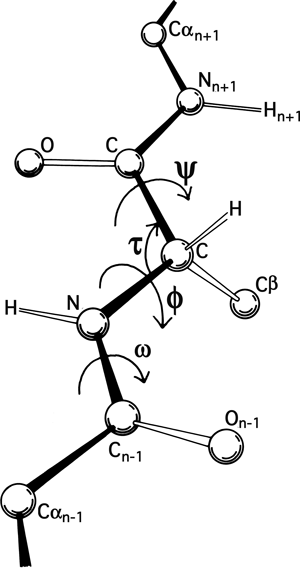
FIG 5. A key to standard nomenclature for the atoms and the more important bond angles and dihedral angles along the polypeptide backbone. Atoms of the central residue are without subscripts.
The basic geometry of amino acid residues is quite well determined from small-molecule crystal structures ; [also ; ] ). In terms of the accuracy of protein structure determinations, all of the bond lengths are invariant. Bond angles are also essentially invariant, except perhaps for τ, the backbone N—Cα—C angle (see Fig. 5). The α-carbon is tetrahedral, which would give 110°, but there are indications from accurately refined protein structures (e.g., ; ) that τ can sometimes stretch to larger values in order to accommodate other strains in the structure. [This has indeed been confirmed (e.g., ). Other bond angles are also now standardly treated as variable, which is certainly realistic at least up to variations of 2-3° .]
The dihedral angle ω at the peptide is very close to 180° (producing a trans, planar peptide with the neighboring α-carbons and the N, H, C, and O between them all lying in one plane), but there is evidence that ω can also vary slightly in real structures. Cis peptides, with ω = 0°, can occur perhaps 25% of the time in prolines [actually, more like 5-10% of the time] but essentially never for any other residue. The proline ring is not quite flat, and occasionally protein structures are now being refined accurately enough to determine the direction of ring pucker (e.g., ). [Ring puckers are now routinely assigned for Pro. The best evidence is that they should be either Cγ exo or Cγ endo .] In the following discussions we will for the most part ignore possible effects such as proline ring pucker and variation in τ and ω.
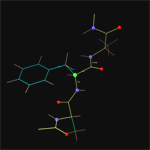
Click the image to download the ' I.B_mobilePept.kin ' kinemage file to view it in interactive 3D with the KiNG software.
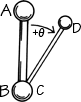
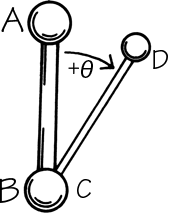
FIG. 6. Standard convention for defining dihedral angles, using four atoms in sequence order either along the main chain or along the major branch of the side chain. Looking along the bond between the central two atoms (in either direction), use the end atom in front as the 0° angle reference. Then the dihedral angle (marked θ) is measured by the relative position of the end atom in back (positive if clockwise, negative if counterclockwise) with respect to the reference atom position.
The remaining dihedral angles are the source of essentially all the interesting variability in protein conformation. As shown in Fig. 5 the backbone dihedral angles are φ and ψ in sequence order on either side of the α-carbon, so that φ is the dihedral angle around the N—Cα bond and ψ around the Cα—C bond. The side chain dihedral angles are χ1, χ2, etc. The four atoms needed to define each dihedral angle are taken either along the main backbone or out the side chain, in sequence order: N, Cα, C, N define ψ and N, Cα, Cβ, Cγ define χ1. The sign, or handedness, of any dihedral angle is defined as shown in Fig. 6: looking directly down the central bond (from either direction) and using the front bond as a stationary reference to define 0°, then the dihedral angle is positive if the rear bond is clockwise from 0° and negative if it is counterclockwise. The choice of reference atom for side chain branches is made according to consistent chemical conventions, but it produces confusing results for the branched β-carbon residues since χ1 of 180° for Val puts its two Cγ atoms in the same position that the branches of Ile or Thr would occupy for χ1 = -60°.
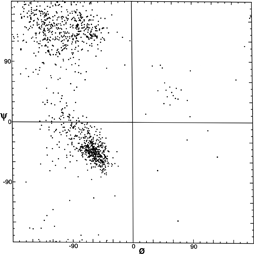
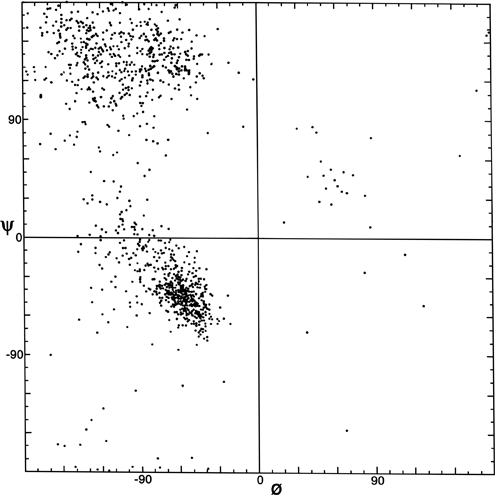
FIG. 7. Plot of main chain dihedral angles φ and ψ (see Fig. 5 for definition) experimentally determined for approximately 1000 nonglycine residues in eight proteins whose structures have been refined at high resolution (chosen to be representative of all categories of tertiary structure).

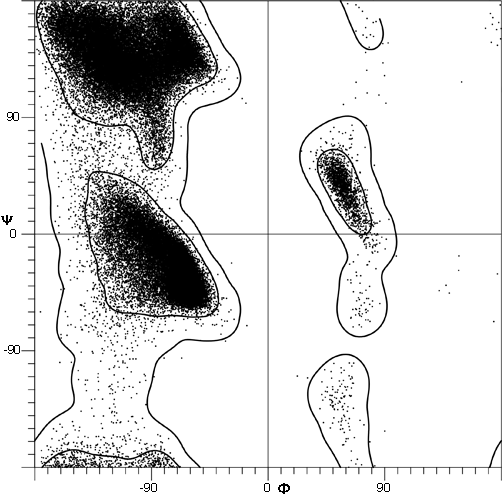
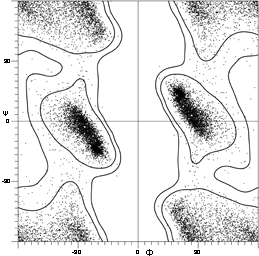
[Fig. 7x is an updated φ,ψ plot for over 80,000 well-ordered (i.e., B<=) non-Gly, non-Pro, non pre-Pro residues in 500 proteins at 1.8 Å resolution or better ; the favorable regions are outlined much more cleanly. Smoothed contours enclose 98% and 99.95% of the data. Extended (or β) conformations lie in the upper left quadrant, helical (or α) in the lower left, and left-handed helical (or Lα) in the upper right.]
The parameters φ and ψ are the most important ones. An extremely useful device for studying protein conformation is the Ramachandran plot which plots φ and ψ. Figure 7 plots φ vs ψ for each nonglycine residue in eight of the most accurately determined protein structures (also picked to be representative of the various structure categories); Fig. 8 plots the glycine φ vs ψ from 20 proteins. The glycine plot is approximately symmetrical around the center, because glycine can adopt both right-handed and left-handed versions of any allowed conformation; however, there are some deviations from that symmetry, such as the different shapes and positions of the left- and right-handed α clusters. [Figures 7x and 8x give updated plots with more accurate and much larger datasets. also show plots for the distinctly different cases of Pro and pre-Pro.]
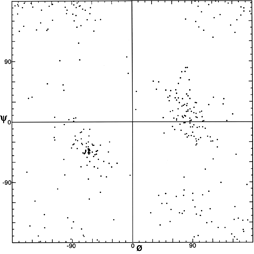
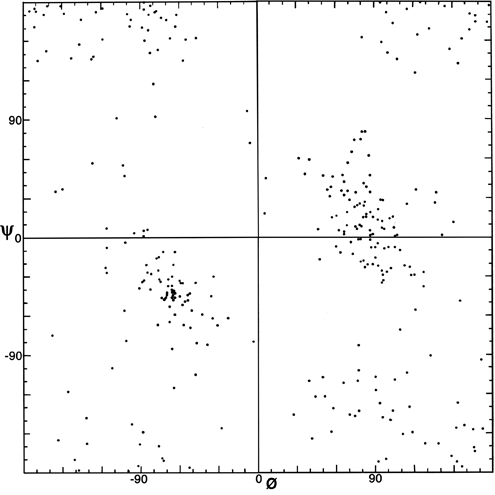
FIG. 8. Plot of main chain dihedral angles φ and ψ experimentally determined for the glycines in 20 high-resolution protein structures.

[Fig. 8x is an updated φ,ψ plot for 7705 well-ordered, high-resolution Gly residues, with smoothed and symmetrized contours that include 98% and 99.8% of the data points (from Lovell et al., 2003).]
***[Cautionary note: the conventions for naming and displaying φ and ψ have been changed twice. The original version in Ramachandran et al. () defined ψ (called φ') in the same way as it is now used but defined φ as φ + 180°, so that the Ramachandran plot (with 0°,0° at the bottom left) had the α-helix in the upper left quadrant. Between 1966 and 1970, Ramachandran plots looked the same way they do now, but 0°,0° was at the bottom left and the numerical values of φ and ψ both differed by 180° from the current convention (e.g., ; ). Now 0°,0° is in the center of the φ,ψ plot, so that taking the mirror image of a conformation corresponds to inverting the numerical φ,ψ values through zero. For the current set of conventions, refer to the IUPAC-IUB Commission on Biochemical Nomenclature [and less drastic revisions that have appeared since (Markley et al., 1998;)] .]***
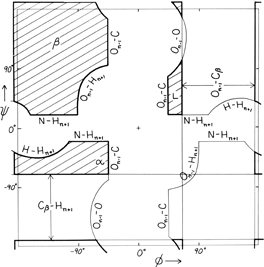
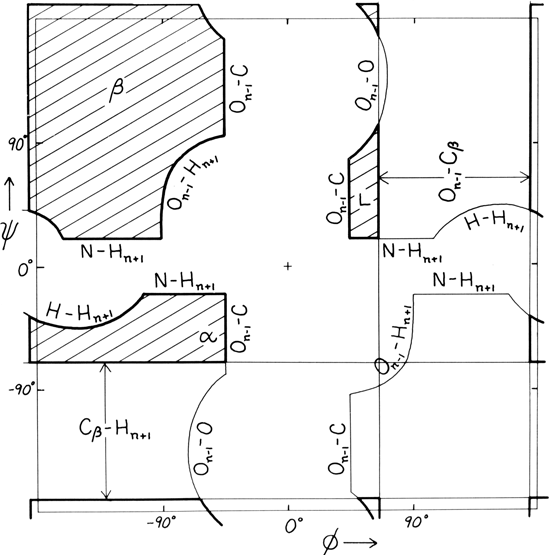
FIG. 9. "Derivation diagram" showing which atomic collisions (using a hard-sphere approximation) produce the restrictions on main chain dihedral angles φ and ψ. The crosshatched regions are allowed for all residues, and each boundary of a prohibited region is labeled with the atoms which collide in that conformation. Atom names are the same as in Fig. 5. Adapted from Mandel et al. (1977), with permission.
Theoretical calculations can provide a rather good understanding of these observed φ,ψ distributions. The first approach is to calculate what conformations are allowed without bump of hard sphere atoms of van der Waals radius. Figure 9 is a "derivation diagram" of the allowed regions, showing which pair of atoms is responsible for each forbidden zone (from ). Four large regions symmetrical around 0°,0° are allowed for glycine. The presence of a β-carbon produces a bump with the carbonyl oxygen of residue n - 1 that is a function only of φ and not ψ and a bump with the NH of residue n + 1 that depends only on ψ and not φ. When the resulting vertical and horizontal disallowed strips are removed from the Ramachandran plot, one is left with fairly large regions around the β and the right-handed α conformations and a small region of left-handed α (Fig. 9). This outline fits the distribution observed in proteins (Fig. 7) fairly well, except for the rather frequent occurrence of residues in the bridge between the α and β regions. That bridge region becomes allowed if the C—Cα—N bond angle τ at the α-carbon is increased (e.g., ), or if the grazing bump between N(i) and H(i+1) is otherwise softened. Detailed conformational energy calculations for alanine dipeptides (e.g., ; ) can reproduce the observed distribution in most respects, in spite of omission of all long-range and medium-range interactions. [The shapes, heights, and positions of peaks and the outlines of favored regions on the updated Ramachandran plots of Fig. 7x and 8x are only approximately reproduced by Fig. 9 or by the dipeptide calculations referenced. Compare, for instance, the diagonal sharp edge of the α peak seen in Fig.7x and the absence of data points in the predicted extension left of α. Significantly better agreement can be produced however, even for Gly, by quantum calculations .]
[Protein sidechains have between 0 and 4 χ dihedral angles (e.g., 0 for Gly, 1 for Ser, 2 for Phe, 3 for Met, 4 for Arg). χ angles around a bond joining two tetrahedral carbons have well-defined optima at staggered values (+60°, 180°, -60°); if one of the atoms has planar bonding (e.g., the Cγ of an aromatic ring), then the χ preferences are more complex. A very powerful generalization about sidechain conformations is that they are "rotameric" - that is, they populate well-defined clusters in the appropriate multi-dimensional space, corresponding to local energy minima. Rotamer "libraries" that list those favored conformation for each amino acid (; ), or smoothed empirical probabilities in multidimensional χ space (MolProbity site at http://kinemage.biochem.duke.edu), are now used extensively in model buildiing of sidechains for either experimental or predicted protein structures.]

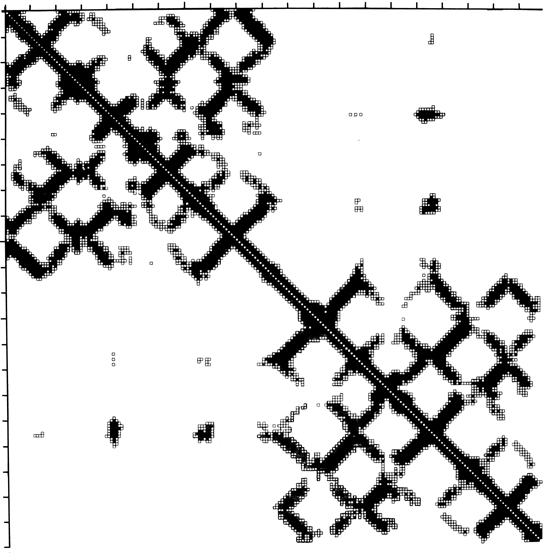
FIG. 10. Diagonal plot of close Cα-Cα distances for an immunoglobulin light chain. Sequence number increases across the top and down the side of the square matrix, and a matrix cell is darkened if the two α-carbons whose intersection it represents are sufficiently close together in the three-dimensional structure. The matrix is exactly symmetrical across the diagonal. The upper left quadrant shows contacts internal to the variable domain, the lower right quadrant those internal to the constant domain, and the off-diagonal quadrants show the rather sparse contacts between the two domains. Bands perpendicular to the diagonal are produced by chain segments running antiparallel to each other (in this case, β strands). Diagonal plot courtesy of Michael Liebman.
Another useful type of representation for protein structures is the diagonal plot. It is a matrix with the amino acid sequence number along both axes, in which either distance between the respective α-carbons or contact between the respective residues is plotted for each possible pair of residues (see Fig. 10). The diagonal plot is probably the most successful method yet devised of quantitatively mapping the chain folding in three dimensions onto the plane (stereo drawings are neither rigorously two-dimensional nor explicitly quantitative).
The large-scale structural features (except for handedness, and perhaps twist) have their counterpart in the diagonal plot: a helix gives a pronounced thickening along the diagonal, for instance, and a pair of antiparallel β strands produce a narrow stripe perpendicular to the diagonal. The appearance of each of the major structure types discussed in Sections III,B-E is fairly clear on diagonal plots, although less distinctive than in three dimensions. For example, the division into two well-separated domains with similar internal structures is extremely obvious in Fig. 10; the first layer of squares out from the diagonal indicates antiparallel organization (fairly narrow bands for β structure, as in this case, and wider bands if the elements were α-helices), the strong bands in the second layer are produced by the Greek key topology (see Section III,B), and the third layer is produced by closure of the barrel. Diagonal plot representations provide crucial simplifications of a number of computational problems (e.g., ; ; ), and they seem to be an especially useful tool for those people who are more at home with an algebraic than with a geometrical representation.
[The most durably useful form of diagonal plot has turned out to be the "difference distance" diagonal plot which shows how different the distances are between the relevant atom pairs, for two different conformations or structures. () It gives a detailed view of structural differences without need for superpositions.]