
The following analysis and discussion of protein structure is based almost exclusively on the results of three-dimensional X-ray crystallography of globular proteins. In addition, one structure is included that was determined by electron diffraction (purple membrane protein), and occasional reference is made to particularly relevant results from other experimental techniques or from theoretical calculations. [More recently, large numbers of structures have also been contributed by nuclear magnetic resonance (NMR) methods, which use experimental measurements of distances between atoms and are reported as ensembles of multiple models equally consistent with the NMR data (see ). The Protein Data Bank (PDB) repository passed 20,000 structures in 2002 and 40,000 in 2006; see http://www.rcsb.org/pdb. References to newer structures in the green update comments will use PDB IDcodes: 4 characters starting with a number, such as 1A6M for oxy-myoglobin at 1 Å resolution .] Even with this deliberately restricted viewpoint the total amount of information involved is immense. Millions of independent parameters have been determined by protein crystallography, and the relationships among almost any subset of them are of potential interest. A major aim of the present study is to provide a guide map for use in exploring this forest of information.
One issue which needs to be discussed before starting the analysis is the problem of evaluating levels of probable error. X-Ray crystallography has a relatively high degree of inherent reliability, because it basically amounts merely to obtaining a picture of the protein. Serious mistakes or experimental difficulties usually produce recognizably unintelligible garbage rather than misleading artifacts. However, there are many minor inaccuracies or problems of interpretation that can affect reliability of the final coordinates. Also, there is now an enormous difference in accuracy between the best and the worst-determined structures: increasing numbers of large proteins are being solved for which the ordered diffraction pattern may not extend beyond 3.5 Å, while on the other hand it is now not uncommon for a protein structure to receive exhaustive least-squares refinement out to 1.5Å resolution. [The contrasts have continued to increase, with many biologically-important large complexes at quite low resolution, but with synchrotron data at cryogenic temperatures allowing some protein structures to be determined at better than 1Å resolution. The kinemage below shows a small piece of a refined electron density map at 1Å resolution (the heme group in the 1A6M myoglobin), illustrating its high and unambiguous information content.]
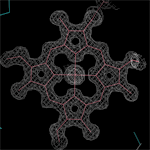
Click the image to download the ' I.C_hemeMap.kin ' kinemage file to view it in interactive 3D with the KiNG software.
The problem of valid error estimation has not yet been solved even for a given refinement technique, mainly because it is difficult to estimate the likelihood of occasional large mistakes in assigning starting coordinates which might not be correctible by refinement. There are now a few cases in which the same structure was independently refined by different methods from independently determined starting coordinates (e.g., ; and , for trypsin), or where two subunits related by noncrystallographic symmetry were refined independently (e.g., , for cytochrome c), so that we may soon develop some empirically based error-estimation procedures. So far the main conclusions from such comparisons are that temperature factors are good indicators of relative error level within a structure and that the standard deviation between independent, well-refined structures is very small (perhaps 0.1 or 0.2Å) for at least 90 or 95% of the atoms, but there are occasional quite large disagreements (as much as several angstroms) that fall well outside the tail of the normal distribution for the smaller errors. [Those occasional large differences or local errors mean that documented rmsd's between independently solved structures of the same molecule are 0.5 - 0.8Å for cases at about 2Å resolution (; ).] For well-refined structures, then, the temperature factor (called "B" ; [see explanatory note] ) is inversely proportional to the relative accuracy of a given atom, or group, position. In the extreme case, an atom that refined to the maximum allowed temperature factor or that was in zero electron density has an essentially undetermined position, and quite probably is actually disordered in the protein.
[The B-factor is an exponential term in the crystallographic Fourier transform equation that describes how fast an atom's scattering falls off with resolution; at that atom position in the map, a high B-factor means that the electron density is smeared out or low. Thermal motion increases B-factors, as can any kind of error, but in proteins high B-factors are primarily due to multiple local conformations (i.e., disorder). B-factors are given for each atom in crystallographic PDB files, and some graphics programs can display or query them easily. Kinemage of 3LZM T4 lysozyme has B-values in the point ID (shown when an atom is picked) and is colored by B-factor on a black-body scale with blue coldest and white hottest.]
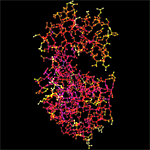
Click the image to download the ' I.C_Bcolor.kin ' kinemage file to view it in interactive 3D with the KiNG software.
In addition to the relative local error level, one must bear in mind that there is always a small but finite probability that the position is grossly wrong, even for an apparently well-determined group. This probability is almost vanishingly small for a structure refined at, say, 1.5Å to a residual of 15% [Actually, it has turned out that even at high resolution sidechains such as Asn, Thr, or Leu can sometimes be fit backwards, producing atom positions off by several Å .] ,but if the residual were 25 or 30% or the data only went out to 3Å resolution, then the likelihood of occasional large errors is quite substantial. [At these resolutions entire loops are sometimes misplaced or β-strands fit out of register.]
There are also some general rules of thumb that can be used to guess at error levels in unrefined and lower resolution structures. A first fundamental problem is to judge when there might be mistakes in the chain tracing that involve incorrect connectivity of the backbone. In a survey of 47 independent chain tracings of novel proteins which have been either confirmed or disconfirmed by further evidence, all of the tracings at 2.5Å resolution or better were correct, whether the sequence was known or not. Below 3.5Å resolution the sequence is irrelevant; with luck, an occasional structure can be traced reliably if it is simple and helical (e.g., ). For the resolution range between 2.5 and 3.5Å, knowledge of the sequence makes considerable difference: only 20% of the structures with known sequences had to be rearranged, while two-thirds of those without sequences had at least one connectivity change. [Note that it is now quite rare to have an unrefined structure, or one with an unknown sequence.] Placement of all the major structural features is correct even when connectivity is not. Assignment of secondary structure elements is apt to be conservative in initial structure reports, so that the helices and β strands initially cited are almost invariably confirmed but additional elements may be recognized later.
In structures for which complete coordinates have been determined but not refined, error levels can be estimated according to position in the protein and what parameter is in question. Quite uniformly, main chain atoms are located more exactly than side chains and interior side chains are better determined than exposed ones. In general, positional parameters are more reliably known than dihedral angles. Ring plane orientation is much easier to determine for Trp, Tyr, and Phe than for His, because the electron density for a five-membered ring is nearly round at lower than about 2 Å resolution. Some parameters are especially prone to an occasional large error. If the carbonyl oxygen showed up clearly in the electron density, then φ and ψ are determined accurately, but if the carbonyl oxygen was not visible, then the orientation of the peptide is quite uncertain: in many cases it can flip by 180° without affecting positions of the surrounding α-carbons and side chains to any noticeable degree. Peptide rotation that is approximately independent of the surrounding chain can be seen between type I and type II tight turns (see Fig. 30). Peptide rotation involves a coupled change of ψ(n) and φ(n+1) by equal and opposite amounts. There may occasionally be true disorder of a peptide orientation in the protein, as has been suggested by dynamic calculations for several external peptides in pancreatic trypsin inhibitor (). φ and ψ are generally less accurately known for glycine than for other residues, because the β-carbon is not present in the map to help determine conformation. Another parameter subject to occasional large ambiguities is χ1. It is not too unusual, for instance, for the side chain electron density of a valine to show definite elongation parallel to the backbone direction but with no clear indication to which side the β-carbon protrudes. Of the two possible χ1 values one is staggered and one is eclipsed. If the crystallographer picks the staggered χ1 value he greatly improves his chances of being correct, but he is undermining the validity of future attempts at empirical determination of χ1 distributions. When the β-carbon is unbranched, the electron density sometimes extends out straight with no indication of the elbow bend at Cβ, in which case χ1 is also difficult to determine.
[Although not discussed here, nucleic acid structures and protein/nucleic acid complexes are an increasingly important part of structural biology. In DNA and RNA crystal structures the bases and the phosphates can be located very accurately but the rest of the backbone is quite difficult, with too many rotatable angles per observable atom ().]
[For NMR structures, levels of error can be estimated by the number of experimental restraints per residue, which plays a role more or less analogous to resolution; "NOE" distance restraints between residues distant in sequence are especially critical. NMR structures are usually reported as an ensemble of multiple models all in similar agreement with the data; the spread between those models shows relative accuracy, and/or mobility, of local parts of the structure, analogous to the crystallographic B-factor.]
In summary, there are three important generalizations about error estimation in protein crystallography. The first is that the level of information varies enormously as a function primarily of resolution, but also of sequence knowledge and extent of refinement. The second generalization is that no single item of information is completely immune from possible error. If the electron density map is available or indicators such as temperature factors are known from refinement, then it is possible to tell which parameters are most at risk. The third important generalization is that errors occur at a very low absolute rate: 95% of the reported information is completely accurate, and it represents a detailed and objective storehouse of knowledge with which all other studies of proteins must be reconciled.